A Sydney transport interchange had daily passenger counts but no live density figure. Operations could not justify additional platform staff without one.
The problem
The interchange had passenger counts in the back office, but they were aggregated daily. Operations could not see a density spike until it was already over. They could not ask for more staff without a live number, and they could not install facial recognition — the public would not accept it, and the regulator would not allow it.
Our deployment
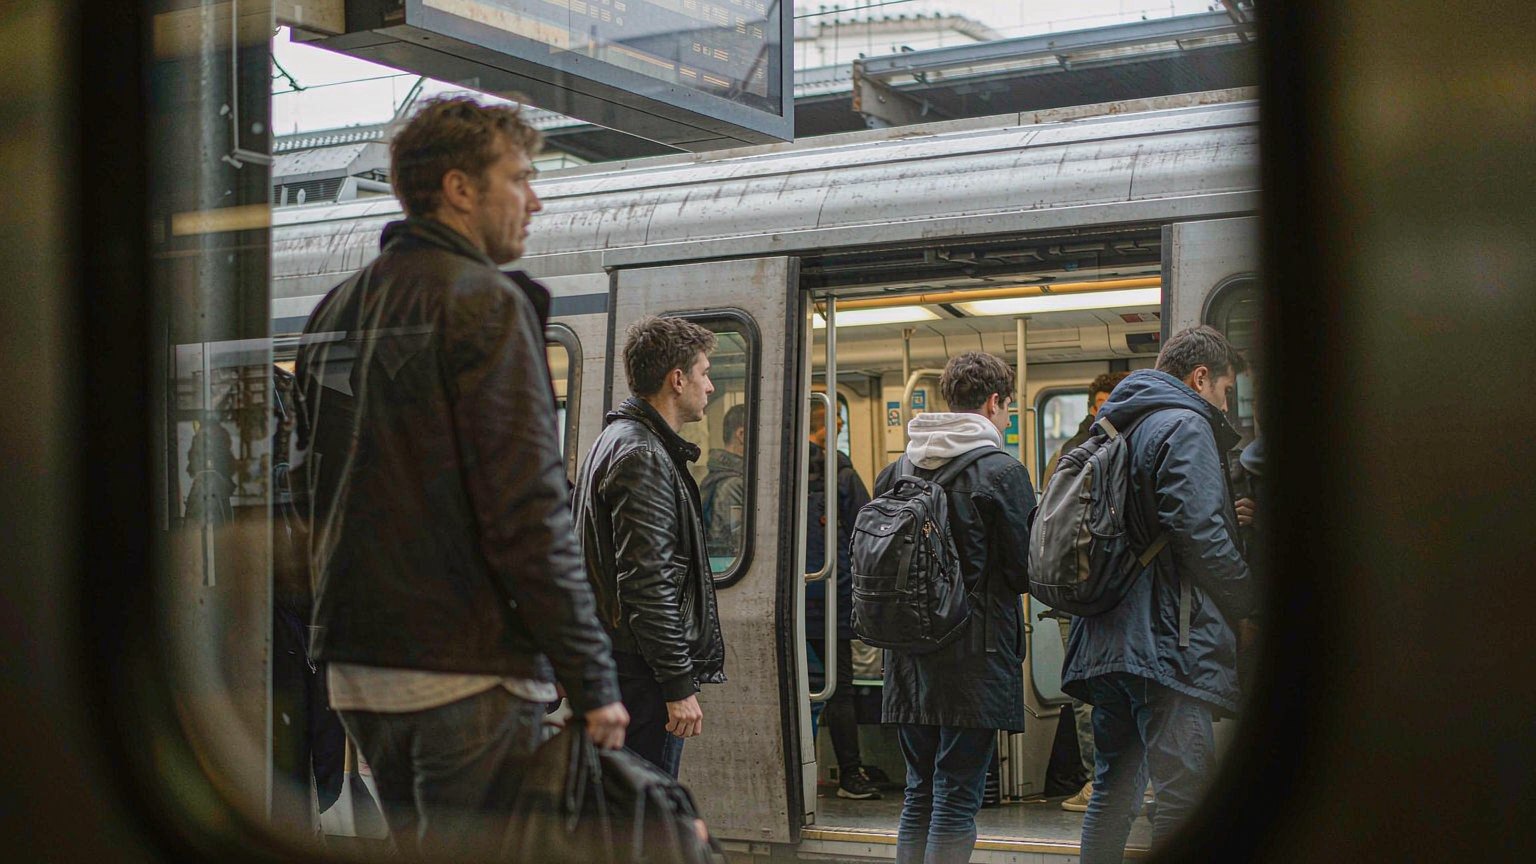
We installed a Canopy CU-3 in the station equipment room, fed by existing platform cameras. The edge ran a density agent on defined zones: entry, platform, bus stop. When a zone exceeded its planned density for more than 60 seconds, operations got an alert. The numbers were aggregated, not individualised.
The result
Operations staff used the live density view to justify two additional platform staff on weekday mornings. The interchange became demonstrably safer during peak, without any new surveillance capability that identified commuters.
Implementation details
The interchange ran a Canopy CU-3 unit in the station equipment room, fed by 14 existing platform cameras. Density zones were drawn on a station floor plan in the console: entry concourse, platform 1, platform 2, bus stop, taxi rank. The density agent reported the number of people in each zone every five seconds, and triggered an operations alert when a zone exceeded its planned density for more than 60 seconds.
The edge unit ran entirely on the station's internal network. The event stream to our Sydney control plane was HTTPS, on a dedicated VLAN. Operations staff saw density in real time on a wall-mounted dashboard in the station control room. No individual was tracked across zones; the number in each zone was aggregated.
What the data showed
Between 8am and 9am on weekday mornings, platform 1 ran at 140% of planned density for 20 minutes. Two additional platform staff were added for that window. Signage at each camera read "Anonymous crowd counting in operation".
Ongoing support
The deployment is now in its second year. Operations staff use the dashboard daily. The planning team uses the aggregated numbers quarterly, to inform timetable and staffing decisions. We have helped the station's security team run a tabletop exercise around a density event; the dashboard was the single source of truth. The edge unit has survived one network outage of 36 hours, with no lost data.